

The LLM evaluation metrics that predict production performance are the ones matched to the cost of each failure. That means cost-weighted error, faithfulness and retrieval quality, human labels and calibrated LLM judges, per-locale results, and hard release gates, all measured on a test set built from your own failures. Public benchmarks are a screening filter, not a release decision.
Most teams measure what is easy to count, like benchmark scores, not what is expensive to get wrong. A production eval set tied to your failure costs is harder to build, and that gap is where releases go wrong, where regressions ship, and where a model that scores well in a demo fails the first real user.
This is a working guide to the metrics that predict production performance, and to the measurement system that catches the failures your users will actually hit. We have built these programs across high-stakes domains and more than 1,000 languages and locales, and the pattern is consistent: the teams that win are not the ones with the most metrics. They are the ones with metrics matched to consequence.
Tired of leaderboard scores that do not predict production failure? Get evaluation data that measures what actually costs you.
LXT builds human-in-the-loop evaluation and annotation datasets for LLM teams, including domain-expert review, multilingual coverage, and cost-weighted error labeling for high-stakes deployments.
Why familiar metrics fail
A model can score highly on MMLU or produce fluent text while still hallucinating, retrieving the wrong evidence, violating policy, or failing the user’s task. Public benchmarks measure broad capability under standardized conditions. They do not replicate your domain, your retrieval corpus, your prompts, your tools, your users, or your risk tolerance.
Our analysis of why public LLM benchmarks fail to predict production performance shows how saturation and contamination mean leaderboard scores often mislead more than they guide.
| Benchmark signal | What it misses |
|---|---|
| 90%+ on MMLU | MMLU has saturated at 93% for frontier models, so it no longer separates good from great |
| High fluency ratings | Fluency and correctness are independent; confident wrong answers read well |
| Strong TruthfulQA performance | A small, English-heavy benchmark; says little about citation behavior in production |
| Top leaderboard ranking | Says nothing about your latency budget, cost ceiling, or policy constraints |
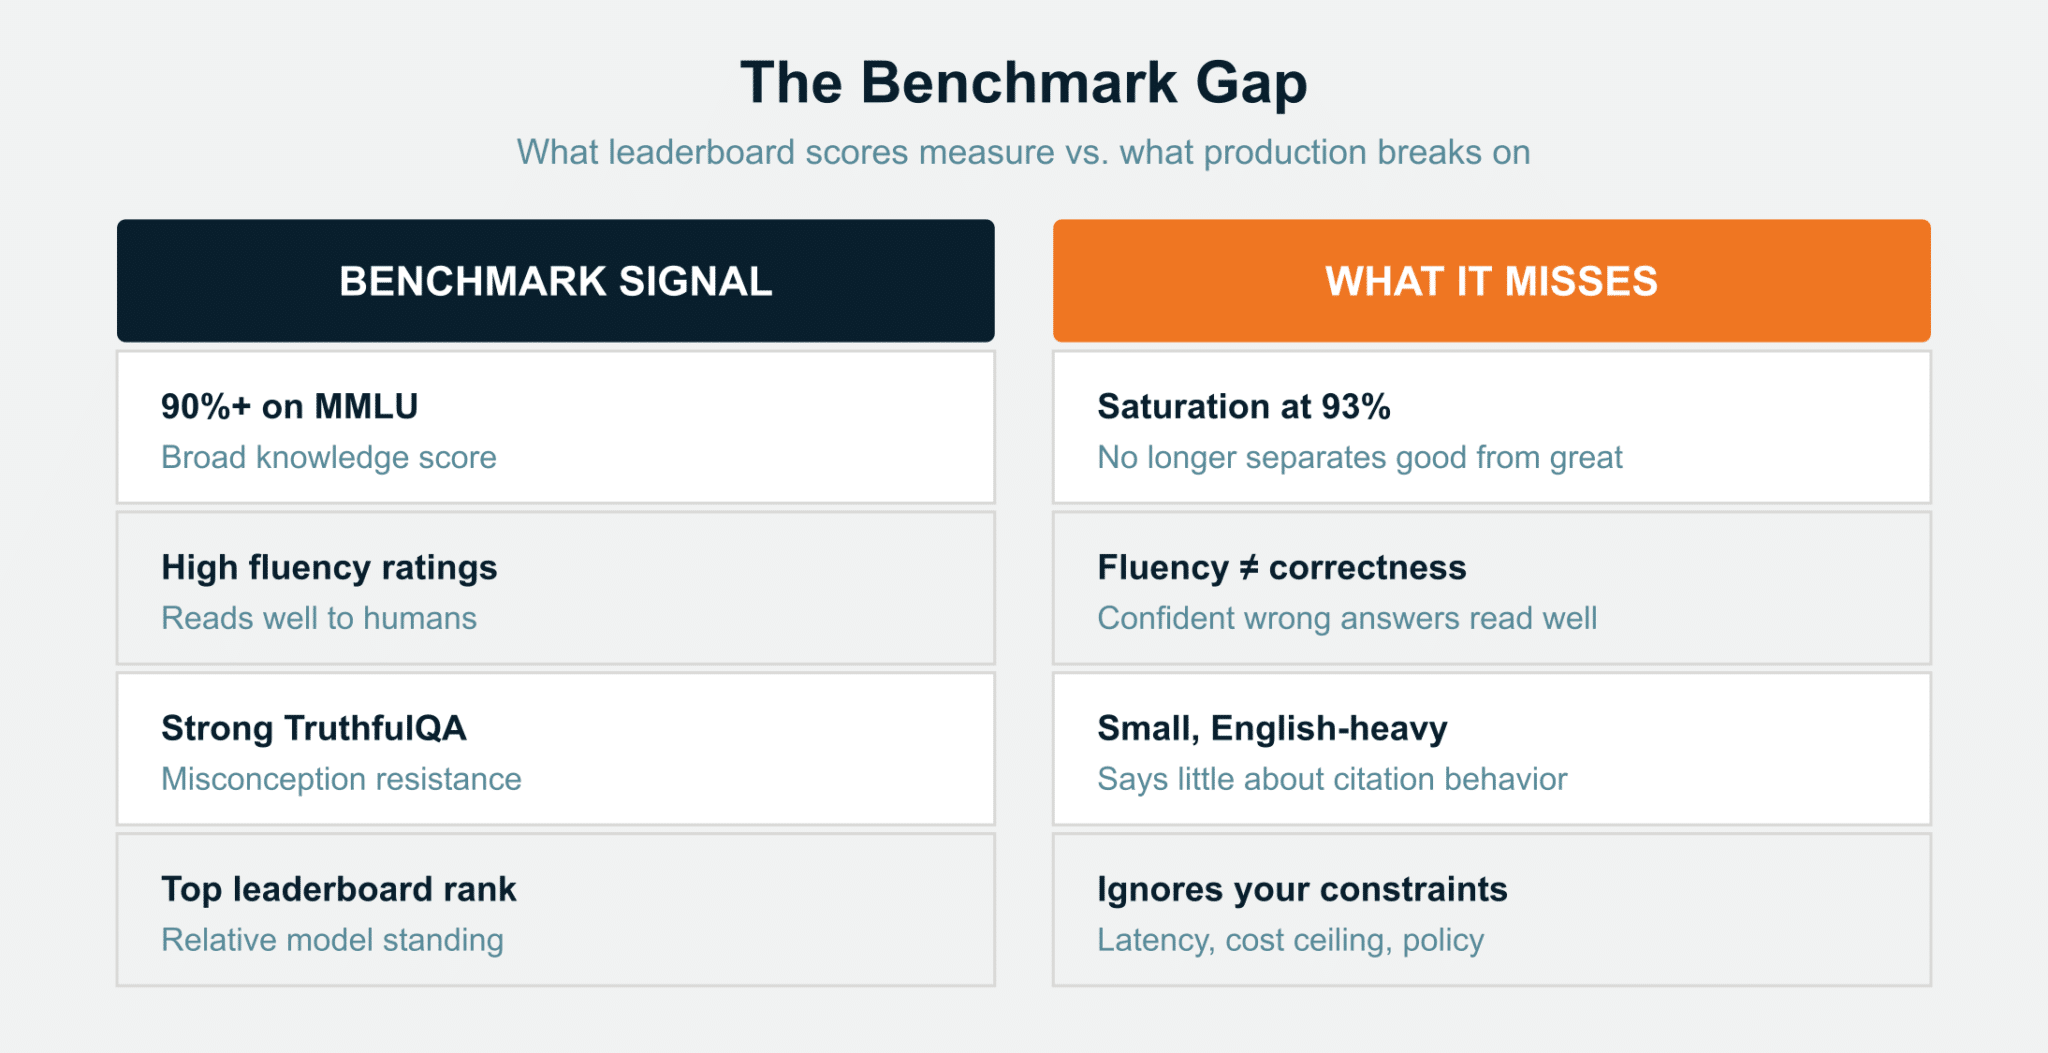
The fix is not to abandon benchmarks. It is to treat them as a screening filter for model selection and build application-specific measurement for everything after.
A useful proof point comes from outside the LLM space. When Stanford’s Center for Research on Foundation Models published HELM, the holistic evaluation framework, it measured seven metrics across sixteen core scenarios rather than reporting one accuracy number. Those seven were accuracy, calibration, robustness, fairness, bias, toxicity, and efficiency. The paper’s finding was blunt: before HELM, models were evaluated on less than 18% of core scenarios, and some leading models had not a single scenario in common. More metrics, chosen deliberately, beat one number every time.
Start with the use case
Before choosing metrics, define seven parameters:
- Users: Who interacts with the system, and what do they expect?
- Task: What specific outcome must the application produce?
- Failure costs: What happens when the system is wrong, unsafe, or unhelpful?
- Abstention behavior: When should the system decline to answer?
- Languages and locales: Which linguistic varieties must you support?
- Latency budget: How long can users wait?
- Policy constraints: What legal, safety, and business rules apply?
A customer-support bot, a clinical summarizer, a search assistant, and an autonomous agent need four different scorecards. Match metrics to your combination.
Two of those parameters are usually named and then never turned into numbers. Both convert directly.
Failure costs become cost-weighted error
Expected loss per query = Σc (error ratec × cost per errorc)
Be honest about where the cost numbers come from: they are estimates, not facts, and the formula does not remove the judgment — it relocates it into the cost assumptions. Anchor each failure class to something real: support-ticket cost, rework hours, churn value, regulatory exposure. Use ranges rather than point values, then run a sensitivity check. If your release decision flips when a cost estimate is off by 2x, the decision was never about the model. The decision rule is simple: ship if expected loss clears your bar and no hard gate fails.
If a wrong price quote generates a support ticket costing $8 and a missed upsell costs $2, a model with higher headline accuracy can still lose on expected loss. Cost-weighted error is also the metric that lets you defend a release decision to a finance team, because it speaks their language.
Abstention becomes a measured threshold
Track three numbers: under-abstention rate (confident answers that should have been declined), over-abstention rate (declines where a correct answer existed), and abstention precision (share of declines that were correct). Tune the confidence threshold against the cost curve, not against intuition.
Metrics mapped to failure modes
Evaluation dimensions overlap. Task success, correctness, factuality and relevance restate each other, and collapsing them into six parallel scorecards hides the redundancy. Start from the failure mode you are trying to prevent and read across instead. Each metric still needs a rubric, a representative dataset, and a stated limitation — if you cannot name what a metric fails to catch, you do not yet understand it well enough to trust it.
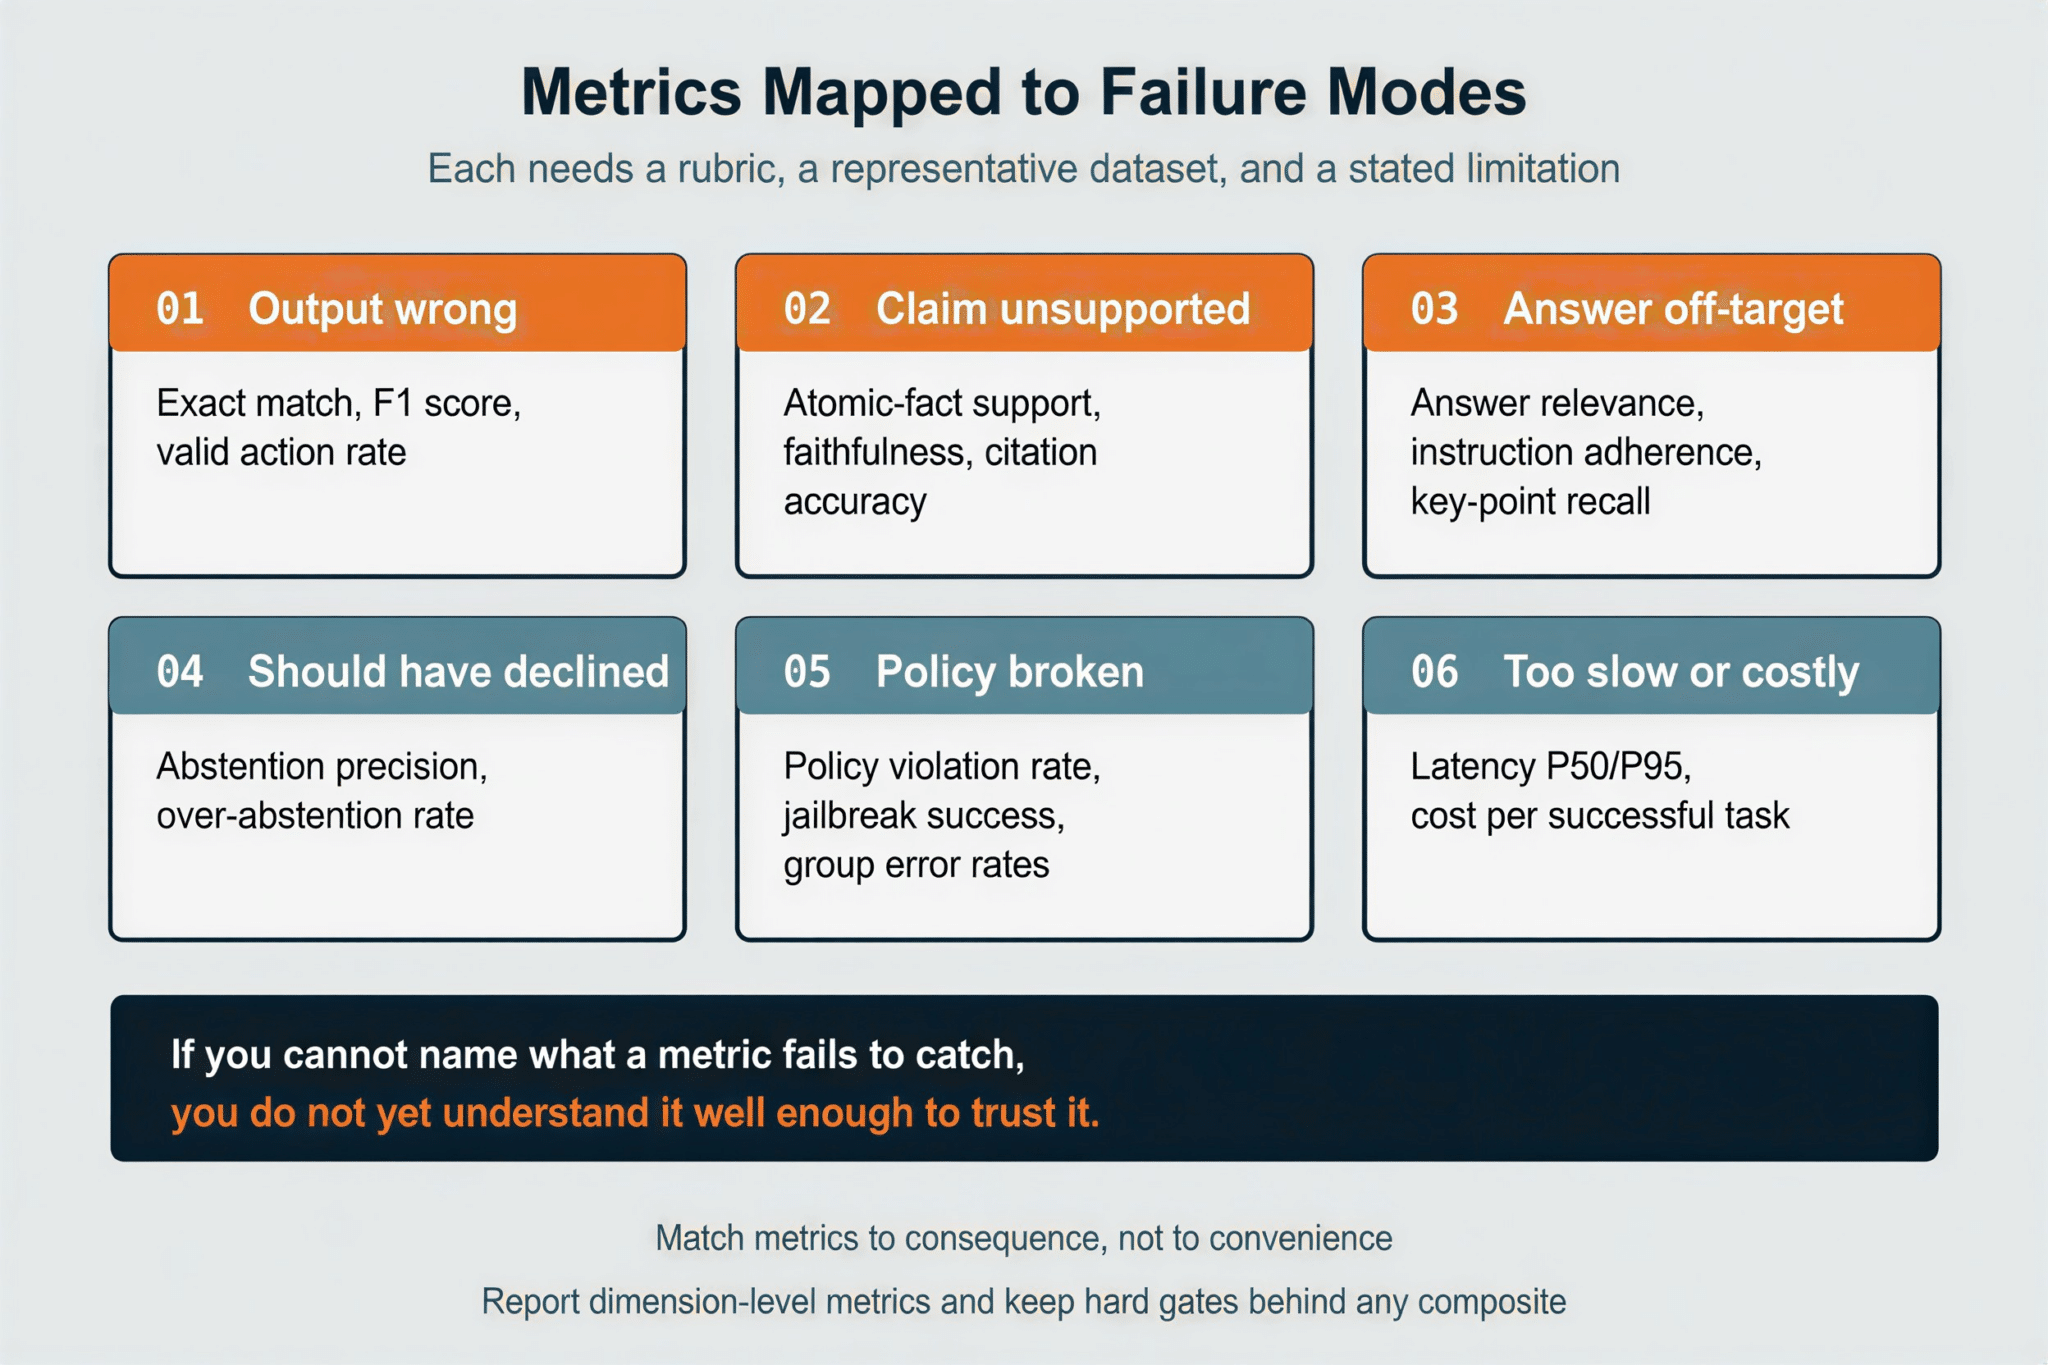
| Failure mode | Metric | What it misses |
|---|---|---|
| Structured output wrong | Exact match | Semantically equivalent variants |
| Extraction wrong | F1 score | Formatting errors that break downstream use |
| Workflow fails | Task completion rate | Whether the path taken was efficient |
| Agent action invalid | Valid action rate | Correct actions taken for wrong reasons |
| Should have declined | Abstention precision | Over-cautious behavior on edge cases |
| Claim unsupported | Atomic-fact support, faithfulness | Claims true in the world but absent from context |
| Citation wrong | Citation correctness and coverage | Attribution pointing at the wrong passage |
| Answer off-target | Answer relevance, key-point recall | Judges reward topical overlap, not answers |
| Rules ignored | Instruction adherence | Rubric wording sensitivity |
| Policy broken | Policy violation rate, jailbreak success rate | Novel failure modes |
| Unfair to a group | Group-level error rates | Small subgroup sample sizes |
| Too slow or costly | Latency P50/P95, cost per successful task | Cost per attempt, where retries hide |
Three of these need more than a row. Correctness: human and domain-expert labels are the source of truth, and calibrated LLM judges can scale this once validated. Factuality: the atomic-fact approach has a canonical implementation in FActScore, published at EMNLP 2023, which breaks a generation into atomic facts and computes the percentage supported by a reliable source; see our grounding-datasets breakdown for the schemas and their limitations. Safety and fairness: use rule-based checks, classifiers, red teaming and human escalation together, not any one alone.
One caveat worth stating: the failure-mode table is a menu, not a checklist. A customer-support bot, a clinical summarizer, a search assistant and an autonomous agent each pick a different handful of rows.
RAG evaluation: Separate retrieval from generation
Retrieval-augmented systems fail in two distinct places. Evaluate each separately, or you will not know which one broke.
Retrieval
| Metric | Measures | Limitation |
|---|---|---|
| Recall@k | Relevant documents retrieved in top k | Ignores ranking position |
| Precision@k | Share of top k that are relevant | Punishes recall-oriented retrievers |
| MRR | Rank of first relevant document | Ignores everything after the first hit |
| NDCG | Graded relevance with position discount | Needs graded judgments, not binary |
| Context precision | Relevant passages ranked above irrelevant | Requires a reference answer |
| Context recall | All needed information retrieved | Requires a reference answer |
Ragas, the reference-free framework published at EACL, defines context precision as the retriever’s ability to rank relevant passages higher than irrelevant ones.
Generation
Faithfulness, answer relevance, completeness, citation quality. Ragas defines faithfulness as the fraction of generated claims supported by retrieved context, verified claim by claim.
Why separation matters
Low context recall points at the retriever. Low faithfulness with high context recall points at the generator. Collapse them into one score and you lose the diagnosis. NVIDIA’s NeMo RAG evaluation metrics documents this split at the implementation level, including a noise-sensitivity metric that measures robustness to irrelevant retrieved context.
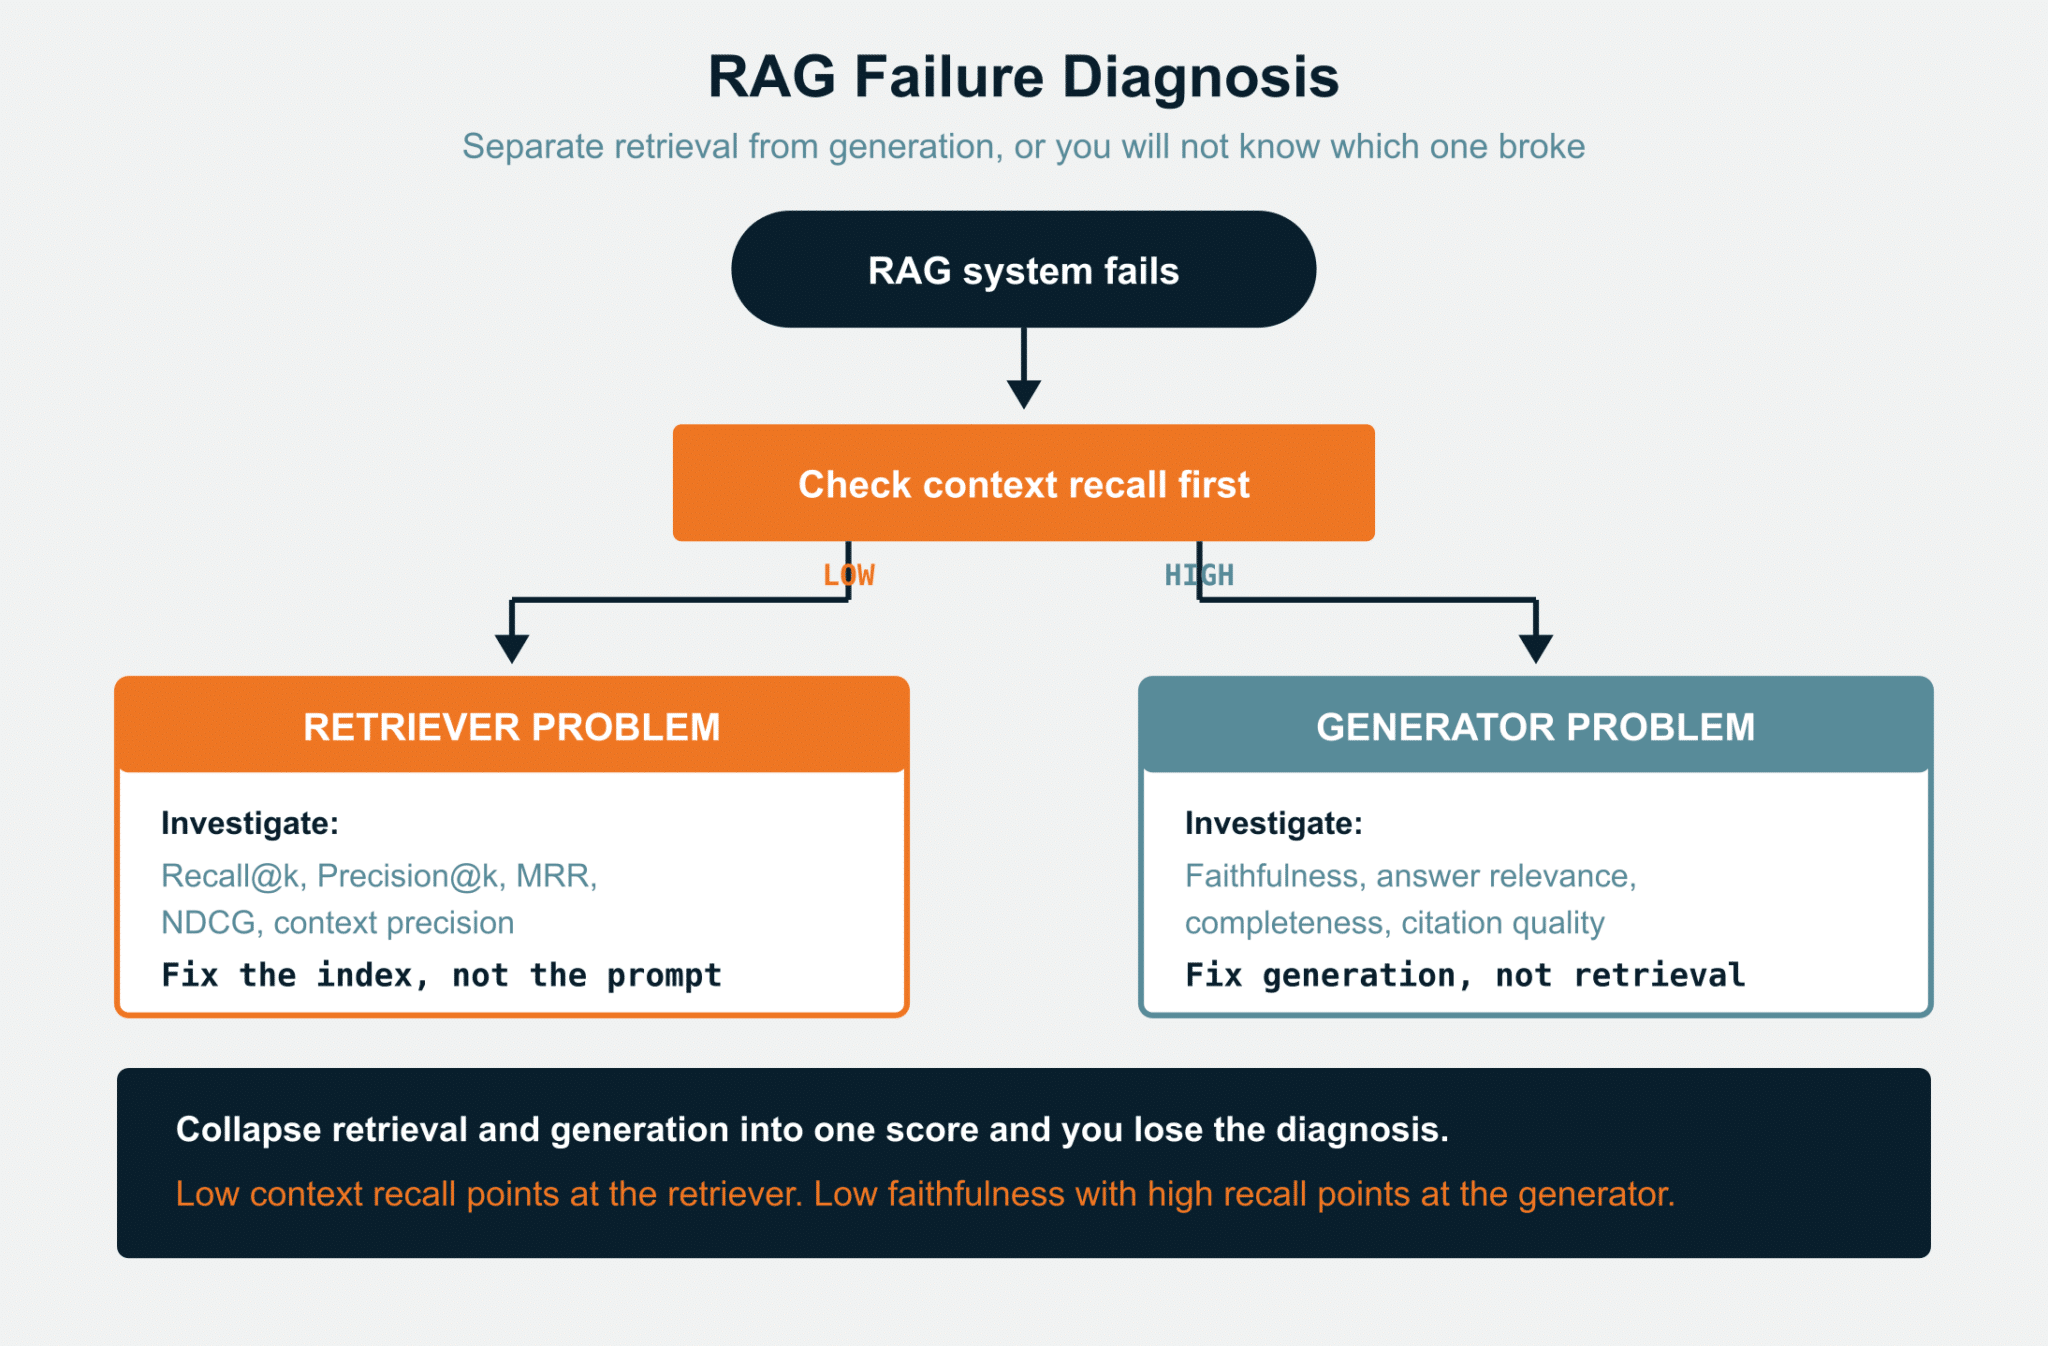
Stanford’s ARES takes a different route: fine-tuning lightweight judge models on synthetic data and correcting them with prediction-powered inference on a small human-annotated set. It scores context relevance, answer faithfulness, and answer relevance separately, and reports that judges hold up across domain shifts.
Retrieval is often where the fastest gains sit. Our search relevance services combine human graded relevance with automated scoring. In one program, we processed more than 100,000 relevance tasks across English, German, and Japanese for a global ecommerce provider, exceeded a 90% quality score in all three languages, and built a localized gold dataset so future measurement had a stable reference point.
Human evaluation: When automation falls short
Automated metrics cannot replace human judgment on ambiguous outputs, high-risk decisions, cultural nuance, novel failure modes, and calibration. Google’s adversarial testing guidance is explicit that classifier accuracy is low for loosely defined constructs, and that human raters are required to check and correct uncertain labels.
Build it properly
- Write specific rubrics. Define correct, partially correct, and incorrect per dimension.
- Train annotators. Run practice cases before production labeling.
- Measure agreement. Use Cohen’s kappa or Krippendorff’s alpha. Treat 0.8 as a working floor for objective span and classification work, and 0.67 as acceptable for genuinely subjective categories.
- Adjudicate. Senior annotators resolve conflicts and refine guidelines.
- Iterate. Update rubrics from disagreement patterns.
Match evaluator to task
Evaluator choice is a design decision, not a staffing detail. In our work on synthetic voice evaluation, we found that one to five trained linguists is enough for detailed, actionable feedback in early development stages, because linguists tend to agree with each other. Lay evaluators give more realistic market feedback, but need 100 to 200 responses per item before the results mean anything.
That trade-off generalizes. Specialists give depth at small scale. Generalists give statistical power at volume. Choose based on which decision the data has to support.
Two risks deserve a place in any evaluation plan. Crowd workers quietly using LLMs on your labels has been measured at 30% to 46% in some studies, as we detail in our data annotation outsourcing guide. And evaluators drift. MUSHRA listening tests handle this by excluding any evaluator who rates a hidden reference as worse than the reference for more than 15% of items, and discarding all of their data.
Our human-in-the-loop services supply the reviewer network, and our AI model evaluation services pair automated pre-screening with expert claim-level verification.
LLM-as-Judge: Scaling with care
Using a model to grade a model is scalable, and it is now well characterized. The canonical study, Judging LLM-as-a-Judge with MT-Bench and Chatbot Arena, measured GPT-4 judge agreement with human preference at around 80%, close to the 81% agreement rate between humans. That is the good news. The same paper documented position bias, verbosity bias, and self-enhancement bias, and the fixes that partly mitigate them.
The self-enhancement problem is sharper than it looks. LLM Evaluators Recognize and Favor Their Own Generations found that models can recognize their own output, and that the ability to recognize correlates with the tendency to prefer it. A judge is not a neutral referee.
Calibration ladder
- Build a human-labeled golden set: 100 to 500 examples covering your key failure modes
- Run the judge on the same examples
- Measure agreement with correlation and a confusion matrix
- Analyze disagreements for systematic patterns
- Mitigate: randomize order, use multiple judge models, avoid self-grading where possible
- Version judge configurations like any other production artifact
Route uncertain and high-risk cases to humans. Braintrust’s practical evaluation guide is a good operational reference for wiring this into a workflow.
Multilingual evaluation: Beyond translated english
Most teams build one English eval set, translate it, and stop. Translation tests translation. It does not test the locale your users speak.
The evidence is starker than most people expect. We ran four leading models against riddle translations into Icelandic and Sinhalese. In that test, three of eight translations delivered the punchline in English rather than the target language, and most models quietly removed the ambiguity the joke depended on. Several used a pivot through English, which works until a specific word in the source language is the point.
Cover four things: locale-specific items written by native speakers, script and encoding handling, code-switching, and linguistic structures like evidentiality and honorifics — those four, not a translated English set.
For speech systems, add accent, dialect, and acoustic environment as explicit strata, and lean on the evaluator-matching discipline above. Our work on low-resource languages and long-tail language audio explains why coverage in 1,000 locales is a sourcing claim while aligned quality in 1,000 locales is a much harder one. Our speech data evaluation services handle the audio side.
The operating rule: report a metric per locale, not per language. A single Spanish score hides the market you are about to launch in.
Statistical rigor: Is that difference real?
Most regressions are declared on samples too small to support them.
A 100-item test set scored at 90% carries a 95% confidence interval of roughly plus or minus 6 percentage points. At 50 items it widens to about plus or minus 8. At 500 items it narrows to about plus or minus 2.6. A three-point improvement on a 100-item set is usually noise.
| Test set size | 95% CI at 90% score | What a 3-point move means |
|---|---|---|
| 50 items | ±8.3 points | Almost certainly noise |
| 100 items | ±5.9 points | Probably noise |
| 500 items | ±2.6 points | Worth investigating |
| 2,000 items | ±1.3 points | Likely real |
Four practices follow:
- Report confidence intervals on every headline metric
- Use paired comparisons. Run candidate and baseline on the same items and test the paired difference rather than comparing two independent proportions
- Average across runs for non-deterministic outputs
- Freeze and rotate the eval set. Reusing items indefinitely overfits prompts to them. Keep a holdout that is never optimized against
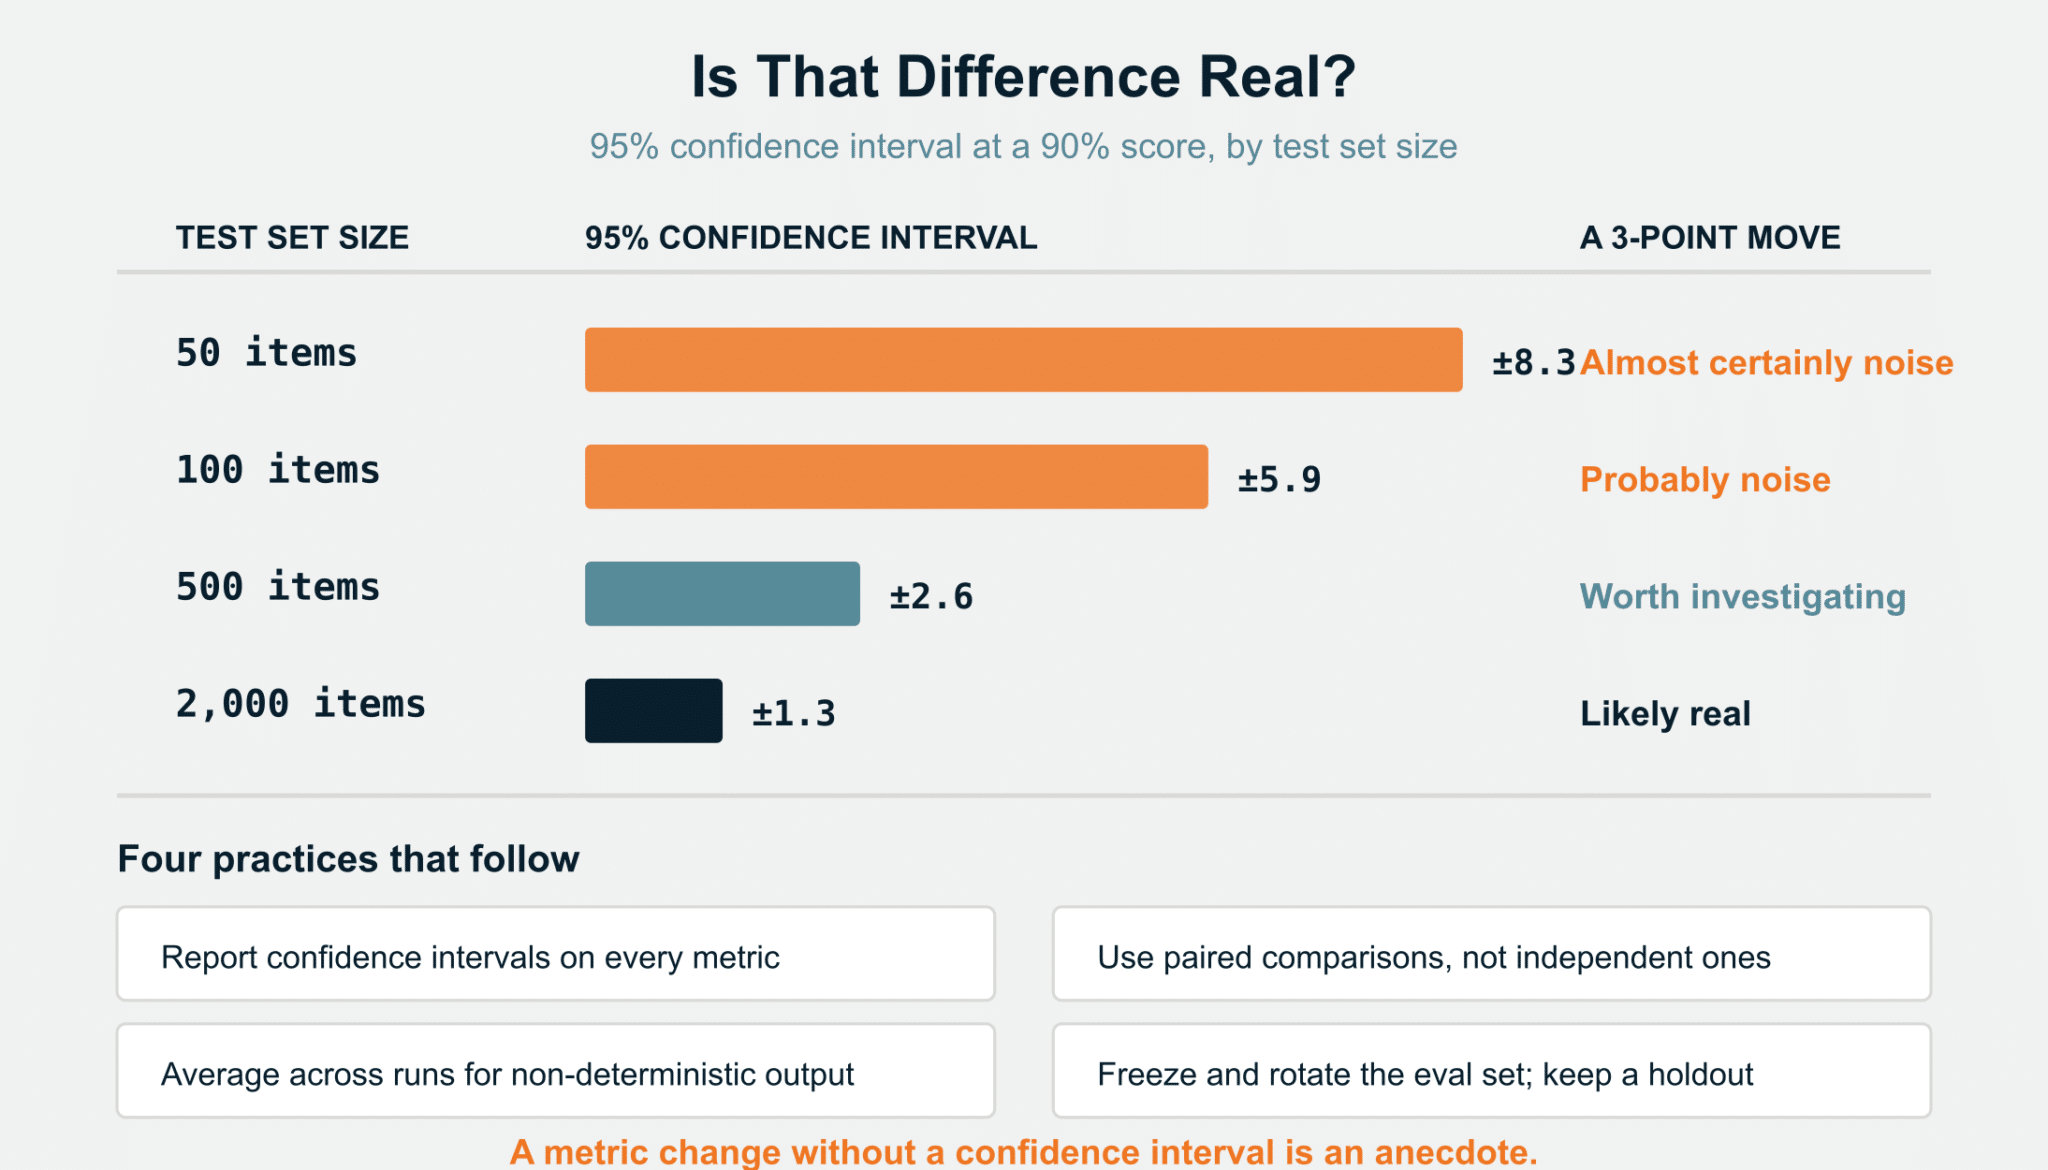
A metric change without a confidence interval is an anecdote.
Alongside confidence intervals, define at least one hard gate: block release if faithfulness falls below 0.95 on a clinical set, or if the policy-violation rate rises at all, regardless of what the composite says. A composite hides trade-offs; a gate refuses to.
Production monitoring
Evaluation does not stop at deployment.
Pre-release: curated test sets, regression tests for known failures, A/B experiments, hard release gates for safety and critical task success. Release: automated evaluation on every code or prompt change, comparison against production baseline, confidence intervals on the delta, manual review of new failures. Production: sampled quality assessment on live traffic, real-time guardrails, drift detection, user feedback integration. Continuous improvement: weekly failure review, categorize new failure modes, add representative examples to the test set, update evaluators where rubrics are thin, retest, monitor for regressions.
What not to overvalue
Aggregate leaderboard scores. A screening filter, not certification.
BLEU and ROUGE on open-ended tasks. Useful for constrained translation and summarization. They penalize valid paraphrase and can reward wrong answers that share vocabulary with a reference.
Perplexity. Measures next-token fit, not accuracy, groundedness, safety, or task success.
Uncalibrated judge scores. See the calibration ladder above.
One composite score. Convenient for executives, but it hides trade-offs. Keep dimension-level metrics and hard gates for safety and factuality even if you also report a composite.
Building the golden dataset
Your evaluation is only as good as its test data.
Input: realistic production input, use case, domain, locale, risk category.
Expected behavior: reference answer where appropriate, supporting source passages, required and prohibited elements.
Human annotation: scores per dimension, annotator rationale with evidence spans, difficulty, failure-mode label, adjudication status, and agreement score.
System context: model, prompt, and retriever versions, with timestamp.
How to source the failures. The set is only as good as where its items come from. Mine support tickets, error logs, thumbs-down events, incident postmortems and red-team findings. Cluster them into failure modes, then sample stratified by frequency multiplied by cost, so a rare-but-expensive failure gets proportional representation. Do not let the set drift toward whatever your current model already does well.
The set should include common cases, edge cases, adversarial cases, multilingual inputs, and previously observed production failures. Where your domain vocabulary is narrow, deliberate skew beats raw volume, as we argue in why your training data should be biased.
Lifecycle. Freeze the set between releases and keep a holdout that is never optimized against. Retire items that the model now passes trivially, and rotate new production failures in — but track which items are old and which are new, or your trend line will be measuring the set, not the model.
Our data evaluation services validate outputs for accuracy, bias, safety, and cultural relevance across 1,000+ languages and locales. Our training data validation and LLM data collection teams build the reference sets behind them.
Worked example: A support bot
Everything above is abstract until you run it once. Take three failure modes: wrong price quoted (cost: $8 support ticket), missed upsell (cost: $2), and an escalation that should have happened but didn’t (cost: $25 in churn-weighted risk). Cost-weighted error is now a number you can move. The metric set is answer relevance, key-point recall on pricing, and escalation precision. The gate is escalation precision above 0.9, non-negotiable. To detect a 3-point move at 90% with a paired test, you need roughly 500 items — which tells you how much annotation work this actually is before you start.
That last step is the one most teams skip: pick the metric, then size the set to the decision, not the other way around.
Metrics by application type
The targets below are field defaults, not literature — calibrate them against your own baseline before treating any of them as a gate.
| Application | Priority metric | Starting target or rule |
|---|---|---|
| Customer support bot | Containment rate with escalation precision | 60 to 70% containment before scaling handoff rules |
| Clinical summarization | Claim-level faithfulness, omission rate on critical findings | Human review below 0.95 faithfulness |
| Code generation | Test pass rate, syntax validity, security scan pass | Validate in a sandbox |
| Search assistant | Recall@10, groundedness, citation quality | Recall@10 at 0.8 for critical queries |
| Conversational AI | Task completion, turn-level coherence, safety | Measure across multi-turn sessions |
| Document extraction | Field-level F1, schema validity | Push schema validity to 100% deterministically |
Our AI agent evaluation framework covers multi-step decision quality and trajectory evaluation. For scaling the human side, our notes on crowd-as-a-service access and MTurk alternatives cover what to weigh when choosing a contributor network.
Summary
- Measure what is expensive to get wrong, not what is cheap to count
- Convert parameters into numbers: failure costs become cost-weighted error, abstention becomes a threshold
- Separate retrieval from generation so failures are diagnosable
- Calibrate judges against human labels before trusting them at scale
- Match evaluator to decision, and control the experiment
- Report per locale, never per language
- Size your tests and put confidence intervals on every headline metric
- Keep dimension-level metrics and hard gates behind any composite
For the workforce, quality metrics, and vendor diligence behind a serious program, our data annotation outsourcing guide is the companion read. Where the work is prompt-level, our prompt engineering and evaluation services test which formulations produce more accurate, helpful, and compliant output.